Subtitle: Some market orders received better price execution than limit orders.
Recently, all market centers disclosed Rule 605 reports for May 2010. This data provides insights into the quality of trade execution across all market centers by ticker, order size, and order type. The following analysis focuses on a favorite focus point of the Flash Crash debate: ETFs. By utilizing the Rule 605 disclosures for May 2010, a volatile month for equities trading, we can observe where ETF trades received better price execution.
There are no clear strong or weak points apparent in the numerous graphs below. Each reader may have an interest in specific ETFs or market centers. Unfortunately, there are too many permutations of ETFs and market centers to be covered within this post. The following graphs sample a few ETF complexes and market centers with the highest trading volumes during May 2010.
More importantly, Rule 605 disclosures summarize trades for the entire month, not itemized by day. Hence, the following graphs do not solely represent trading activity on May 6, 2010, when many ETF orders were cancelled as a result of extreme price volatility resulting from brief market illiquidity. (Judging from the wide range of price improvement statistics, these cancelled trades appear to be included in the data, but one cannot assume the all market centers included erroneous trades in their disclosures.) For some ETFs and specific market centers, the price volatility on May 6 may have been large enough to significantly impact the summary statistics for the entire month. Nevertheless, a comparison of the same statistics across ETFs and market centers should demonstrate how trade execution performed on a relative basis.
In previous posts (iShares/NFS and Schwab/UBS) concerning ETF trade execution quality, Fundometry studied how much trades were executed inside the NBBO, at the market, and outside the NBBO for specific market centers. One post defined a useful summary metric called Weighted Average Price Impact ("WAPI"). In the Rule 605 disclosures, price impact (in dollars per share) is disclosed separately for trades where price improved and degraded (or, as some might say, disimproved) relative to the subsequent NBBO. The overall price impact of trades can be summarized by averaging the price impact for individual categories of trades, based on improvement or degradation relative to the NBBO and weighted according to respective volumes in each category. A positive WAPI indicates that overall more shares traded with price improvement (i.e. price at execution was better than the NBBO when the order was submitted) than with price degradation, and the opposite would be implied by a negative WAPI.
In addition to WAPI, the following graphs plot volume of executed orders, including orders routed to other market centers. Ideally, this data on trade execution would be itemized separately for internal orders and orders routed to other market centers (in cases where the best price existed at another venue). Unfortunately, the data summarizes trade execution quality across all orders executed regardless of venue (internal or external). In order to highlight the impact of orders executed internally to any given market center, only data is included if the volume of internal orders contituted at least 80% of total executed volume. (The final graphs in this post follow a stricter threshold of 5%.)
Finally, both WAPI and volume are broken down by market orders and marketable limit orders - the only two types of orders for which price improvement/degradation statistics are available.
Based on the Rule 605 disclosures sampled in this analysis, three ETF complexes had the largest trading volumes of market and marketable limit orders during May: SPDR, iShares, and ProShares. Initially, ETFs will be summarized at the complex-level (volume-weighted summary of all tickers within an ETF family) across different market centers (exchanges, ECNs, ATS, etc). Subsequently, selected individual ETFs will be analyzed in greater detail, by order size and order type. (Given the number of graphs involved, including other ETF complexes or selecting more individual ETFs would cause this post to become rather voluminous.)
Complex-Level Perspective
In these complex-level graphs, market centers displayed along the horizontal axis are sorted according to overall WAPI. Market centers which executed orders with overall price degradation (outside the NBBO recorded at the time the order was submitted) are displayed closer to the left side. Despite this sorting order, some market centers achieved notably better or worse trade execution quality depending on the order type (market vs marketable limit).
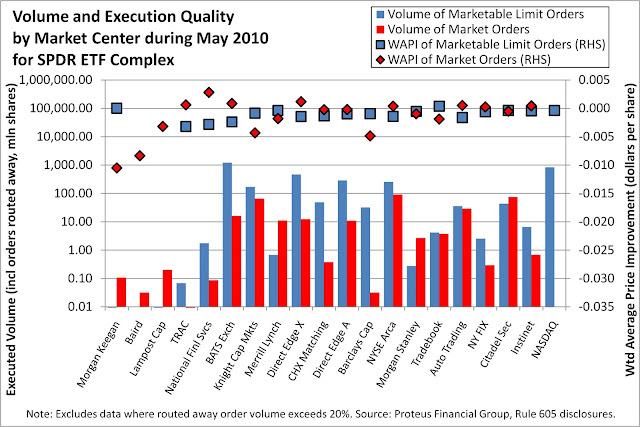
The following graph summarizes trade execution quality for SPDR ETFs during May 2010.
.jpg)
For the SPDR family of ETFs, a few low-volume market centers exhibited the least favorable trade execution quality. Among market centers with notable volume, National Financial Services (NFS), BATS, and Knight Capital Markets performed less favorably relative to their peers, in terms of WAPI. Depending on the market center, market orders received better price execution than marketable limit orders (as seen when red diamonds are higher than blue diamonds). While there is no clear indication of where market orders should have fared better, marketable limit orders (a buy order above the best offer or a sell order below the best bid) did not always result in better price execution than market orders.
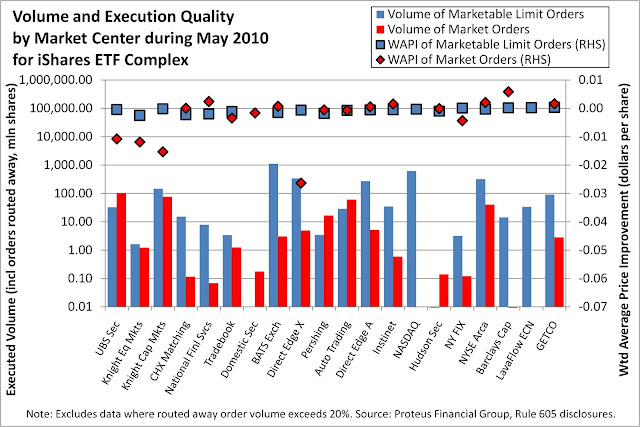
The following graph, which summarizes trade execution quality for iShares ETFs during May 2010, shows that orders executed at UBS, Knight, and Chicago Stock Exchange (CHX) Matching System received less favorable price execution relative to their peers. CHX and NFS executed market orders (red diamonds) at better prices than marketable limit orders (blue diamonds), but the opposite was the case at UBS and Knight. Direct Edge X exhibited the most negative WAPI among market orders.
.jpg)
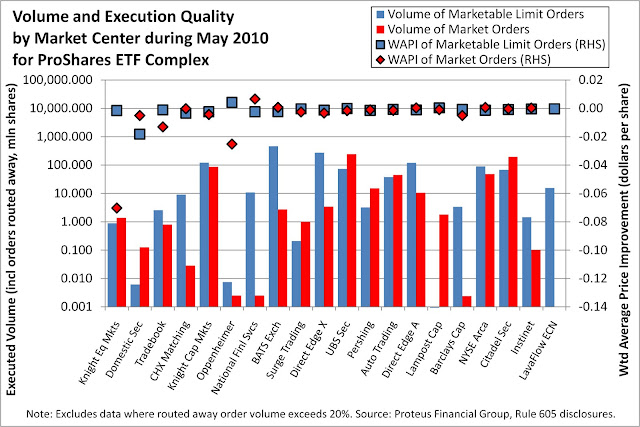
The following graph for ProShares ETFs shows that Knight Equity Markets executed marketable limit orders with a reasonable WAPI but achieved relatively poor execution quality with market orders. Conversely, Knight Capital Markets achieved reasonable WAPI for both types of orders. Among peers, Oppenheimer exhibited the best WAPI for marketable limit orders but performed poorly with market orders. Again, one can observe how order type matters depending on the venue.
.jpg)
Focus: SPDR ETFs
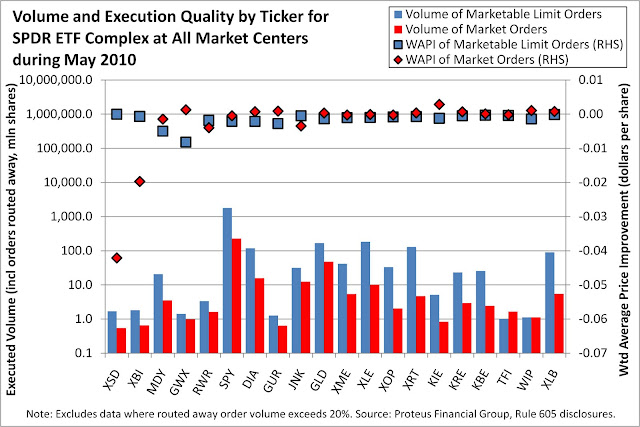
The graphs above summarize trade execution quality for different market centers across all ETFs within a single family. Conversely, the following graph summarizes trade execution for different ETFs in the SPDR complex across all market centers.
.jpg)
Two ETFs with the least favorable WAPI, XSD and XBI, exhibited worse price execution for market orders than for marketable limit orders. Otherwise, market orders received more favorable execution, based on price, than marketable limit orders for most of the other tickers (even though volume for market orders was substantially lower than for marketable limit orders). In comparison to other tickers, MDY and GWX exhibited less favorable price execution for marketable limit orders. These four ETFs merit more detailed analysis.
The following graph drills down into trade execution quality by order type and order size for XSD.
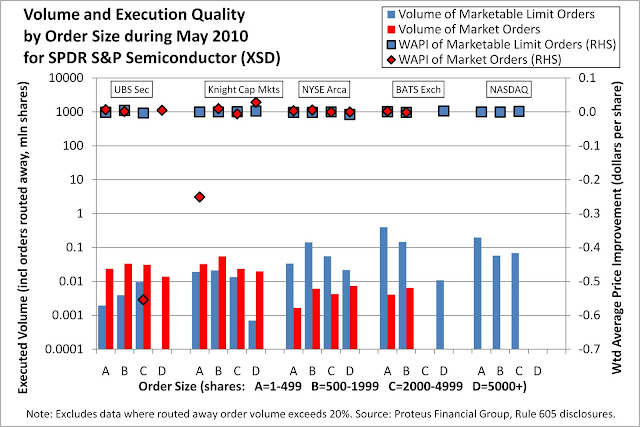
Interestingly, two specific categories of market orders account for the unfavorable WAPI: (1) order quantity 2000-4999 (order size code "C") executed at UBS Securities and (2) order quantity under 500 shares (order size code "A") executed at Knight Capital Markets. Furthermore, the most favorable WAPI for market orders in this graph occurred at Knight Capital Markets for order quantity over 5000 shares (order size code "D"). Given that the fragmentation of market structure generally favors smaller orders for achieving better execution quality, the results at Knight are unexpected.
Does the same graph for XBI result in similar observations?

Yes and no. As was the case for large-quantity market orders for XSD executed at Knight, the largest-quantity market orders (2000-4999 shares) for XBI executed at NYSE Arca achieved the most favorable WAPI, certainly better than smaller-quantity market orders. At Knight, larger market orders (2000-4999 shares) received substantially less favorable WAPI than market orders with the largest-quantity (over 5000 shares). However, at Automated Trading Desk, the largest-quantity market orders (over 5000 shares) received substantially unfavorable WAPI than all other comparable orders on this graph. (Note that the total volume on some of these categories of market orders is very small.)
In the two graphs above, the WAPI for marketable limit orders was very consistent relative to market orders. Two SPDR ETFs which exhibited unfavorable execution, based on WAPI, for marketable limit orders are MDY and GWX. The following graph drills down into trade execution quality for MDY.

Marketable limit orders for MDY executed at Barclays Capital and Direct Edge X received increasingly less favorable WAPI as the order size increased. This pattern follows the broad expectation that smaller orders receive better price execution. To a lesser extent, the same pattern is evident at BATS Exchange and NASDAQ. However, market orders received more favorable WAPI than marketable limit orders, based on comparable order sizes.
The same graph for GWX yields less conclusive observations.
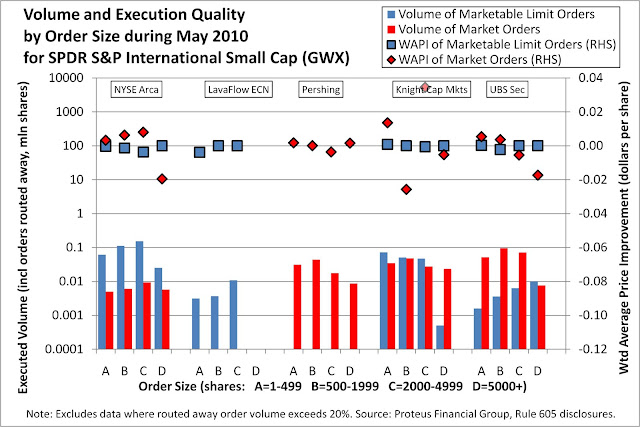
At NYSE Arca, Knight Capital Markets, and UBS Securities, marketable limit orders received better WAPI when the order size was smaller, but the opposite trend occurred at LavaFlow ECN (where volume was also lower). At UBS Securities, market orders received better WAPI when their order size was smaller, but at Knight there was no conclusive pattern to how well a market order would be executed according to its size.
Focus: iShares ETFs
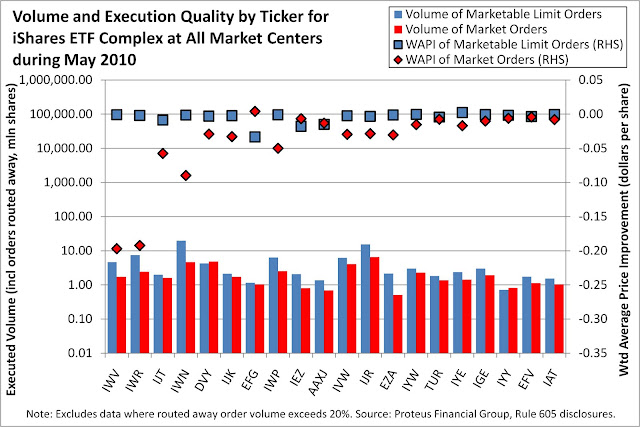
Switching from the SPDR to iShares complex, the following graph summarizes trade execution for different ETFs in the iShares complex across all market centers.
.jpg)
Two ETFs stand out in terms of unfavorable WAPI for market orders: IWV and IWR. In addition, for marketable limit orders, EFG exhibited a less favorable WAPI than its peers. The following three graphs analyze what happened with each of these iShares ETFs.

For IWV, one could easily miss any anomalies in the trade execution quality. The red diamond at the lower left region represents substantially negative WAPI for large-quantity market orders executed at Knight Capital Markets. Smaller market orders at Knight received better execution. Other market centers exhibited reasonable results.

The results for IWR are surprisingly consistent with IWV. Large-quantity market orders executed at Knight received substantially negative WAPI, as indicated by the red diamond in the lower left region. The remaining data points are easier to view when this one negative outlier is excluded from the graph.
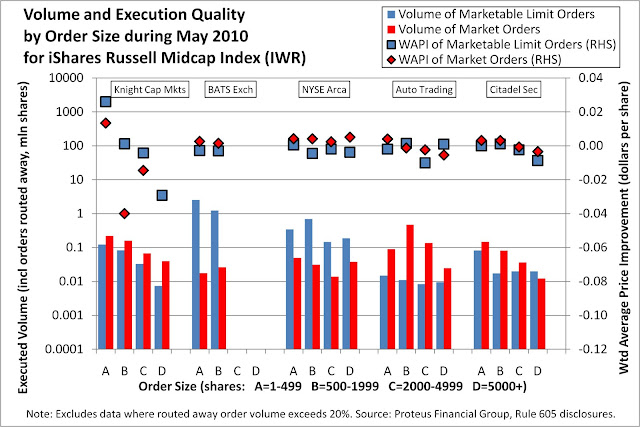
Across all five market centers, marketable limit orders received less favorable WAPI as the order size increased, with a few exceptions. At Knight, only the smallest-quantity market and marketable limit orders achieved positive WAPI. At NYSE Arca, market orders once again exhibited more favorable WAPI than marketable limit orders of comparable order size. While Automated Trading Desk executed market orders with more favorable WAPI as the order size decreased, the same pattern could not be observed for marketable limit orders.
Before switching focus to EFG, one may wonder whether orders for other iShares ETFs exhibited substantially negative WAPI at Knight. The following graph indicates that IWV and IWR were unique outliers, but some other ETFs also exhibited less favorable WAPI for market orders: IVW, IWP, IJT, IJH, and IJR.

For EFG, the least favorable WAPI for marketable limit orders occurred at E*Trade Capital Markets, although the magnitude is insignificant when compared to results for IWV and IWR.

At E*Trade, the largest-quantity marketable limit orders for EFG exhibited substantially unfavorable WAPI versus other market centers. Knight Capital Markets executed marketable limit orders with improving WAPI as the order size increased (again, counter to expectations based on general market structure). Even NYSE Arca and Pershing followed a similar pattern with respect to market orders (i.e. more favorable WAPI as order size increased), except when Pershing executed the largest-quantity market orders.
Focus: ProShares ETFs
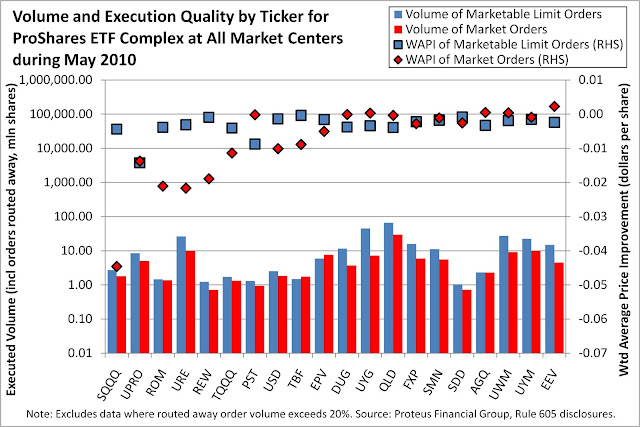
The following graph summarizes trade execution for different ETFs in the ProShares complex across all market centers.
.jpg)
As shown in the next two graphs, both SQQQ and UPRO exhibited similar patterns to earlier examples for selected SPDR and iShares ETFs. In the case of SQQQ, market orders of quantity 2000-4999 executed at Knight Capital Markets received the least favorable WAPI, although not of significant magnitude in comparison to IWV and IWR.
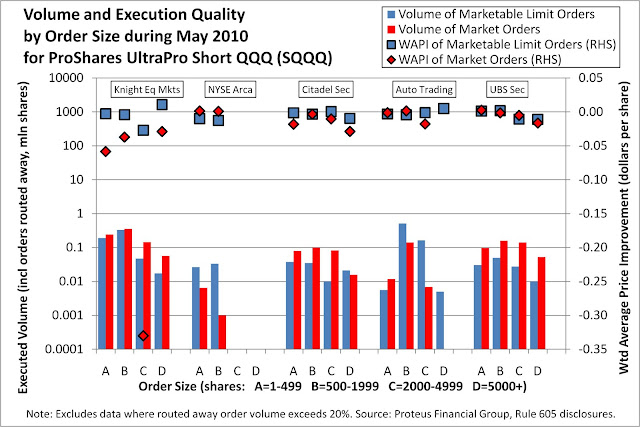
For UPRO, the largest market orders executed at Knight received the most negative WAPI.

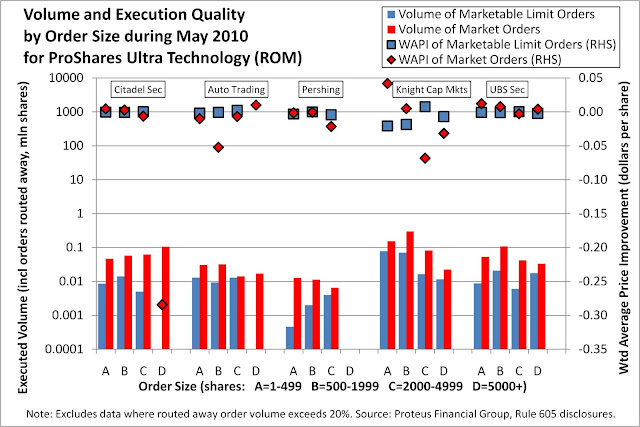
However, for ROM, market orders of the largest-quantity (5000 or more shares) exhibited the least favorable WAPI at Citadel Securities, although Knight and Automated Trading Desk also executed market orders with relatively less favorable WAPI.
Conclusions
Depending on the market center and specific ticker, trade execution quality, as measured by Weighted Average Price Improvement, varies wildly. As seen in the graphs above, robust generalizations are difficult to draw.
1. Marketable limit orders do not always receive better price improvement than market orders. Marketable limit orders are limit orders which should be executed immediately, as with market orders, because either the order bid is higher than the best offer or the order offer is lower than the best bid. Depending on the market center, market orders can receive better price improvement versus marketable limit orders of comparable order size. In other words, executing a market order may result in price improvement despite the fact that many erroneous trades involved stop loss market orders.
2. Depending on the specific ETF, market center does matter. Among the small sample of graphs above, some market centers repeatedly achieved less favorable price improvement than their peers. The Rule 605 disclosures cover only orders for which a market center was not specified by the investor. As a result, the data should reflect efforts to route orders to the market center which has the best NBBO at a given time. However, identifying the reasons why an order executes at a specific venue requires more data than available through the Rule 605 disclosures.
3. Major market centers with a large share of volume (usually synonymous with deep liquidity) do not necessarily achieve better price improvement. Regardless of trading volume, some market centers appear to execute market orders with better price improvement than for marketable limit orders. The same complex-level graphs shown above are available with market centers sorted from left to right in order of trading volume: SPDR, iShares, ProShares.
4. Typically, order size does matter. Depending on the market center and individual ETF, smaller orders might achieve better price improvement than larger orders, but many instances of the opposite exist. At least one should not assume that smaller orders always achieve better price improvement, especially with market orders. Since some trade execution statistics are based on small order volumes, one should study more periods of history in order to draw statistically robust conclusions.
For those seeking a more league-tablesque summary, the following graphs may be more satisfying. These graphs list the most and least favorable price improvement performances for combinations of individual ETFs and market centers. Market orders and marketable limit orders are shown separately, as their overall magnitudes of WAPI are different.
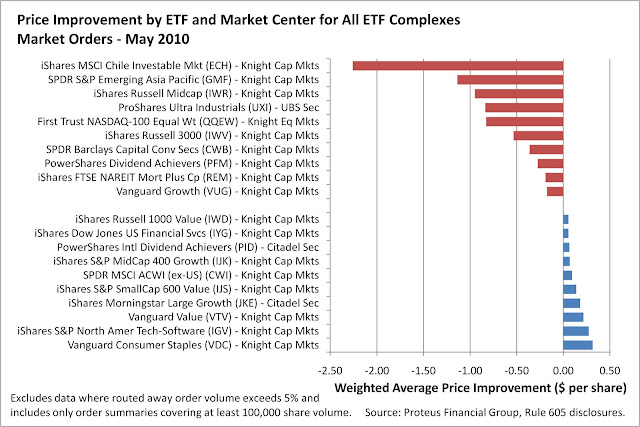_OT11_OS(All).jpg)
_OT12_OS(All).jpg)
One of the market centers should be familiar by now (if not, this WSJ article might help). For those seeking a comparison, the same graphs for April are available for market orders and marketable limit orders.
Clearly, May was an exceptional month as highlighted by the price impact of ETF trades. In such challenging and volatile markets, is the quest for price improvement worthwhile, or would a market center be better off routing an order elsewhere? For investors, the dilemma is even more complicated: which ETF, order type, and order quantity would work best? There can be no assurance that if Flash Crash II ever occurs, the quality of price improvement will follow similar patterns.