Last month's post highlighted a preliminary indicator of a bottoming out and turnaround in the lending of securities held by registered mutual funds. A recent update of data from the SEC indicates that lending capacity, or a willingness to lend, among bond mutual funds remains well below the peak in 2007. (From the previous post, remember that the data collected for this analysis indicates only whether a fund has lent securities but not specifically how many of them.)
Given the illiquid markets for many types of fixed income securities, one might expect a much lower supply (demand) for lending (borrowing) bonds. Even short-sellers who identify profitable dislocations in the market may hesitate to risk a short squeeze, should lenders decide to call back the bonds. The uncertainty in prices for many bonds, as a result of a dearth of trading activity, might make the calculation of margin requirements too challenging and risky to justify the revenues from lending.
The drop in securities lending capacity among bond funds is equally prevalent in index funds and actively-managed funds. Historically, index funds focused on reducing their net expenses to shareholders by collecting additional fees from short-sellers (borrowers). Thanks to counterparty risks and pricing concerns, further aggravated by Lehman's bankruptcy, the benefit of reducing an expense ratio, by collecting extra lending revenue, does not justify the risks. Bond index funds cannot afford the reputational risk either.
(Note concerning the graphs: In the previous post, the date axis reflected the earliest date within a six-month semi-annual reporting period. In order to more clearly reflect the latest date, graphs will reflect the latest date of a six-month semi-annual reporting period. For example, data points as of 11/30/2009 are based on data from 6/30/2009 through 11/30/2009.)
For actively-managed bond funds (excluding index funds), the capacity for lending securities has been steadily declining since 2008, both for funds which choose to lend and funds which prohibit lending securities.


For index bond funds, the trend is similarly downward trending. The population of such funds, in terms of number and AUM, is very small - on the order to only $200 billion compared to over $5 trillion for actively managed bond funds. Therefore, the trend can shift abruptly if a few large index funds change their policy. Furthermore, note the very small sample size for September 2009.


The drop in lending capacity has been less severe for both equity index and actively-managed funds. For the most part, equities did not suffer the degree of illiquidity which hit the bond markets in 2008 and 2009. Given sufficient trading activity, lenders appear comfortable with loaning out shares. If a lender or custodian wants to call back the securities, a borrower can most likely repurchase the securities through an exchange or ATS, venues which outside of the Treasurys are quite non-existent for bonds.
For actively-managed equity funds, the portion of the population actively lending shares has decline steadily since late-2007. However, during 2009 this trend appeared to be reaching a turning point. This stabilization has yet to prove a turnaround.

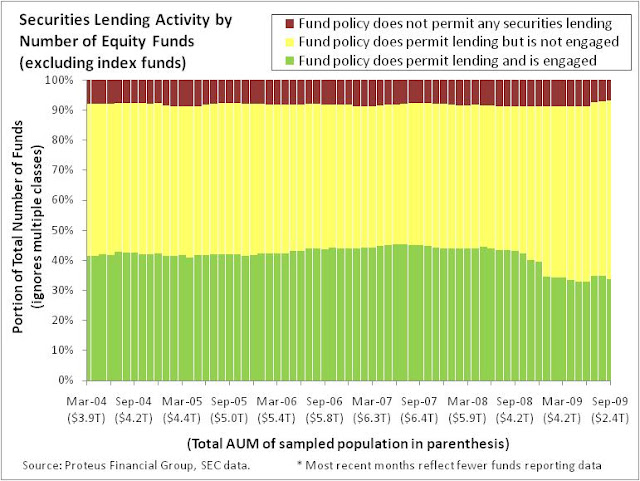
In terms of assets (AUM), the vast majority of equity index funds lend shares, but in terms of number of funds, they appear to utilize securities lending similarly to their actively-managed counterparts. Of course, this implies that the largest equity index funds are dominating the supply of lendable shares. Overall, the decline in securities lending also appears to be muted. One reason should be that equity index funds should be inclined to loan securities given the additional revenue has a relatively material impact on reducing their expense ratios.


Furthermore, actively-managed equity funds are more likely than their indexed counterparts to not allow securities lending (represented by the red bars). By number of funds, the portion which utilize securities lending (green bars) are consistent between the active and passive groups.
The next update will include funds reporting through December 2009, which constitutes a large portion of the entire sample. Then we should be able to better determine the near-term course of these trends.
No comments:
Post a Comment