Friday, April 9, 2010

In Search of Price Improvement for Schwab ETF's


When Charles Schwab sold its capital markets affiliate to UBS in October 2004, the industry took notice of the impact: UBS gained significant market share in NASDAQ equities trading as well as the sizable equities order flow from Schwab's customers. Schwab does not receive rebates or other payments from UBS. Nevertheless, part of the consideration Schwab received for the sale was a commitment to route orders through UBS for eight years, starting in 2004.


Normally, Schwab charges a commission for trading equities and options. However, on November 3, 2009, Schwab announced the launch of their proprietary ETF's as well as their unprecedented $0 online commission rate for Schwab clients.


Does this no-commission/no-rebate arrangement have any impact on order flow or order execution? Comprehensive details are not easy to collect, but the following analysis is an attempt at providing some insights from data which is available.


This analysis utilizes Rule 605 disclosures for the following exchanges and ECN's ("market centers"): UBS, NASDAQ, NYSE Arca, BATS, DirectEdge, Instinet, Knight Capital, and Citadel. The sample period covers November 2009 through January 2010. Other market centers executed or routed orders for Schwab ETF's, but this sample accounts for 72% of the trading volume over the sampling period.


Below, we look at various statistics among some of these market centers with a specific focus on UBS.


(Note on the following graphs: Individual ETF's are aggregated according to their sponsoring firm into "ETF complexes". Although the selected ETF complexes have trading volumes larger and smaller than that of the Schwab complex, Schwab's ETF volume should fall roughly in the center of the distribution. Shown next to each ETF complex is the aggregate volume, over the sample period, expressed in millions of shares. The graphs do compare ETF complexes with varying amounts of liquidity, but one can isolate those with similar trading volumes by noting the figures in parenthesis.)


What happens when a broker (assumed to be Schwab) routes a Schwab ETF order through UBS?


We observe how many shares are traded at market centers other than UBS, out of all shares routed and traded through UBS. Few other ETF complexes get such exclusive treatment by UBS, certainly none as large as the Schwab complex. UBS traded fewer shares of First Trust, Rydex, and WisdomTree ETF's (10.4, 9.3, and 11.9 million shares respectively) than Schwab (17.3 million shares) yet routed more of their orders to other market centers.


What happens when a Schwab ETF order is routed through other major market centers?


If a market center cannot fill an order at the best price (national best bid and offer, or "NBBO"), then that center should route the order to another venue where a better price is available. On that basis, other market centers don't seem as capable as UBS in achieving best trade execution for Schwab ETF's. Perhaps this makes sense if the investors trading Schwab ETF's are mostly Schwab clients. As seen above, although NYSE Arca handles orders representing 2.1 million shares of Schwab ETF's, it routes almost 10% of those orders to other market centers where better prices are presumed to have been available.


How well did UBS fill those orders which it chose to handle internally (i.e. not route to other market centers)? Given the data available, we can look at how many shares were executed inside the quote (known as "price improvement"), at the quote, and outside the quote. The following graphs display the percentage of shares which fall into one of these "three tiers" of execution quality. Most orders are either market orders or marketable limit orders. Therefore, we report the two types separately since there may be inherent differences between the manner in which market orders and marketable limit orders are executed. One would especially hope for price improvement on market orders, but no worse than filling at the quote.


Given that UBS executed almost all Schwab ETF's orders internally, it is interesting to see how UBS fills market orders. Among complexes of comparable trading volume, Schwab ranked quite low on price improvement. UBS achieved the best price improvement for iShares ETF's, at about 75% of the total 228 million shares traded with market orders. First Trust ETF's, with a smaller volume of 9.1 million shares traded with market orders, still saw price improvement for 65% of that order flow. UBS achieved price improvement for Schwab ETF's for about half of the 14.7 million shares traded with market orders. The results for at the quote and outside the quote fills are respectable, but nothing special either.


For marketable limit orders, UBS handled Schwab ETF volume of 2.6 million shares. Price improvement ranked somewhat better across the same sample of ETF complexes, but not by much. Approximately 3% of shares traded with marketable limit orders saw price improvement, while almost all others were executed at the quote. UBS achieved the best rate of price improvement for Victoria Bay ETF's with a higher volume (24.6 million shares). ETF's from First Trust and Rydex, with 1.3 and 1.6 shares traded respectively, saw better rates of price improvement even though their volumes are smaller than that of Schwab ETF's.


The same statistics are available at other market centers. Results can be skewed depending on the order volume handled by each market center. Hence, the initial table, showing volume of executed orders by market center, may be a helpful reference.


In comparison to other ETF complexes, NYSE Arca executed market orders and marketable limit orders for Schwab ETF's with modest price improvement, which falls near the lower end of the range. Note that the volume of market orders is very small, only 0.1 million shares of Schwab ETF's executed and no more than a million shares for any other ETF complex. The volumes for marketable limit orders was higher, with 2.0 million shares of Schwab ETF's executed, and Schwab ranked roughly in the middle of the distribution.


Similarly, Schwab ETF's traded on NASDAQ with very little price improvement, but nevertheless ranked near the middle of the range among other ETF complexes with comparable volumes. NASDAQ did not disclose any statistics for market orders.


For orders executed at BATS, Schwab ETF's received the most-frequent price improvement for marketable limit orders in comparison to peers, while price improvement seldom occurred for market orders. Out of 0.8 million shares traded in Schwab ETF's with marketable limit orders, BATS achieved price improvement for approximately 12% of the order flow. While this percentage is much lower than the rate of price improvement achieved by UBS, Schwab ETF's ranked better than other comparable ETF complexes for marketable limit orders executed at BATS.


While digesting these graphs, consider these additional factors.


1. The trading activity spans only three months, although all market centers and ETF complexes are compared over the same period. Schwab launched its proprietary ETF's in November 2009, hence relevant activity does not exist for prior months.

2. Only online orders entered through Schwab are commission free. Orders entered through other channels (e.g. phone) are not advertised as commission free, even though those orders would likely be executed through UBS. The available data does not provide any information on the order entry method. Hence, this analysis assumes that the majority of Schwab ETF's orders routed through UBS were entered online.

3. Other attributes may differ between orders routed through UBS and orders routed through other market centers. No details are available on actual limit prices on limit orders, and the specific execution times and applicable NBBO's are not provided. However, further analysis can be performed on the amount of price improvement at the ticker level.

Execution quality is challenging to track and measure. The summarized data used in this analysis attempts to compare execution quality among major market centers at the level of ETF complexes. While not digging into finer levels of comparison (ticker level or specific month), this analysis demonstrates that Schwab ETF orders routed through UBS almost exclusively get executed at UBS and generally with less frequent price improvement than orders executed at UBS for other ETF complexes. Nevertheless, the other market centers in the sampled data exhibited even less price improvement.


UBS probably has an advantage versus other market centers due to its sizable portion of order flow for Schwab ETF's, even though other ETF complexes with smaller volumes (such as Claymore, WisdomTree, and Rydex) achieved more frequent price improvement at UBS. On the other hand, UBS achieved price improvement for other ETF complexes (such as iShares, Vanguard, PowerShares) to a greater extent than for Schwab ETF's even though a larger portion of orders were routed to other market centers.


Would paying a commission in order to trade an iShares ETF have resulted in more cost-effective execution than paying no commission to trade a Schwab ETF? The answer may depend primarily on order size and the frequency of trading. This analysis is not exhaustive and cannot be conclusive, but the sampled data demonstrates that paying no commission when trading an ETF might not always result in the lowest overall execution cost.

Saturday, February 27, 2010

Can Money Market Funds Have Too Much Liquidity?


On Jan 27, 2010, the SEC adopted a new set of rules governing how registered money market funds operate. A number of these rules were adjustments to certain requirements already existing under Rule 2a-7. While the new rules are material changes relative to current requirements, they might not sufficiently address the root causes of some challenges still facing the money market fund industry.


After the Reserve Fund broke a buck shortly after Lehman Brothers filed for bankruptcy, the SEC and investors have been concerned about the perceived safety of money market funds. The Treasury was concerned enough to create the Temporary Guarantee Program, highlighted in an earlier [post]. The SEC has debated how to change the rules governing these funds. Floating the $1.00 NAV price has been a consideration, but the fund industry's resistance and concerns from that idea have prompted the SEC to focus on other adjustments to the rules.


There are some interesting restrictions on credit quality and maturity of underlying investments. Highlights from the SEC's [summary] of the new rules:

1. Restrict the maximum weighted average maturity ("WAM") of the total portfolio to no more than 60 days, versus the previous limit of 90 days.
2. Limit illiquid securities (those which cannot be liquidated or disposed of within seven days at carrying value) to no more than 5% of total fund assets, versus the previous limit of 10%.
3. Highly liquid securities, which must be convertible into cash within one day and one week, must be no less than respectively 10% and 30% of total fund assets.
4. Limit investments in Second-Tier Securities (generally rated A-2/P-2) to no more than 3% of total fund assets, versus the previous limit of 5%.
5. Limit the maturity of any Second Tier Securities to 45 days, versus the previous limit of 397 days.
6. "Know Your Investor" procedures require money market funds to anticipate potential redemption requests based on the type of investors and past investor behavior.

In essence, all of these requirements seek to ensure that money market funds will be able to accommodate a spike in redemption requests. The Reserve Fund scenario seems to be the case study to which these new requirements are targeted. New monthly disclosures to the SEC, made public with a 60 day lag, will put more pressure on portfolio managers to follow these new rules with a high degree of certainty. As a
result, a portfolio manager might target a WAM which is comfortably under 60 days.


However, one consequence of these rules could be a drop in demand for commercial paper maturing beyond 60 days and other short-tenor bonds which otherwise would cause the fund's WAM to exceed 60 days. This penalty for tenor comes at a time when many corporations, including banks, rely heavily on investors to restructure and rollover maturing debt. More frequent maturing of commercial paper will result in reduced flexibility for corporations to manage their interest expenses. As interest rates rise, as most likely they will over time, corporations and government agencies might need to re-issue short-term debt more frequently and at higher rates.


Should a crisis in confidence or some other major credit event occur, bond issuers will have less time to address their refinancing needs. During a major market crisis, an additional 30 days (difference between a 90-day to 60-day maximum WAM) can be instrumental to survival. Ironically, one firm's inability to survive a liquidity crisis prompted the debate which resulted in these new requirements.


How do money market funds currently manage the WAM in their portfolios? Should we expect a major change in behavior as a result of the new rule?


Specifically with respect to the new WAM requirement, the SEC appears to have implemented a minor tweak in reality. The graph below shows historical WAM as reported to the SEC by registered money market funds, which generally invest in short-term bonds (those maturing within one year). Since past disclosures to the SEC are semi-annual (future disclosures to the SEC will be monthly), the graph shows a six-month historical rolling average which tries to capture the WAM for the entire population. However, there are still variations in WAM during the interim months of the semi-annual reporting periods which may cause these averages to lag reality somewhat.


According to this data, a large majority of money market funds appear to manage their portfolios to a WAM under 60 days. At least 75% of the population (red line), measured in terms of assets, would appear to not be impacted by the new restrictions on maximum WAM. Even the 10% tail of the population (yellow line) with the highest WAM appears to require only some minor adjustments to their future investments. The median (green line) consistently maintains a WAM of under 50 days.


Will these historical norms of managing investments in money market funds be sufficient to meet the financing needs of corporations and government agencies? When markets were more favorable, many issuers found better pricing in the intermediate-term and long-term bond markets. Since the latter half of 2007, issuers facing financial difficulties have been forced to rely more on the short-term bond market than desired. Hopefully, those issuers are not relying too much on registered money market funds to rollover their debts, or else they may want to revise upwards their interest expense projections.

Friday, February 26, 2010

Securities Lending by Index Funds Still Recovering

Last month's post highlighted a preliminary indicator of a bottoming out and turnaround in the lending of securities held by registered mutual funds. A recent update of data from the SEC indicates that lending capacity, or a willingness to lend, among bond mutual funds remains well below the peak in 2007. (From the previous post, remember that the data collected for this analysis indicates only whether a fund has lent securities but not specifically how many of them.)


Given the illiquid markets for many types of fixed income securities, one might expect a much lower supply (demand) for lending (borrowing) bonds. Even short-sellers who identify profitable dislocations in the market may hesitate to risk a short squeeze, should lenders decide to call back the bonds. The uncertainty in prices for many bonds, as a result of a dearth of trading activity, might make the calculation of margin requirements too challenging and risky to justify the revenues from lending.


The drop in securities lending capacity among bond funds is equally prevalent in index funds and actively-managed funds. Historically, index funds focused on reducing their net expenses to shareholders by collecting additional fees from short-sellers (borrowers). Thanks to counterparty risks and pricing concerns, further aggravated by Lehman's bankruptcy, the benefit of reducing an expense ratio, by collecting extra lending revenue, does not justify the risks. Bond index funds cannot afford the reputational risk either.


(Note concerning the graphs: In the previous post, the date axis reflected the earliest date within a six-month semi-annual reporting period. In order to more clearly reflect the latest date, graphs will reflect the latest date of a six-month semi-annual reporting period. For example, data points as of 11/30/2009 are based on data from 6/30/2009 through 11/30/2009.)


For actively-managed bond funds (excluding index funds), the capacity for lending securities has been steadily declining since 2008, both for funds which choose to lend and funds which prohibit lending securities.


For index bond funds, the trend is similarly downward trending. The population of such funds, in terms of number and AUM, is very small - on the order to only $200 billion compared to over $5 trillion for actively managed bond funds. Therefore, the trend can shift abruptly if a few large index funds change their policy. Furthermore, note the very small sample size for September 2009.


The drop in lending capacity has been less severe for both equity index and actively-managed funds. For the most part, equities did not suffer the degree of illiquidity which hit the bond markets in 2008 and 2009. Given sufficient trading activity, lenders appear comfortable with loaning out shares. If a lender or custodian wants to call back the securities, a borrower can most likely repurchase the securities through an exchange or ATS, venues which outside of the Treasurys are quite non-existent for bonds.


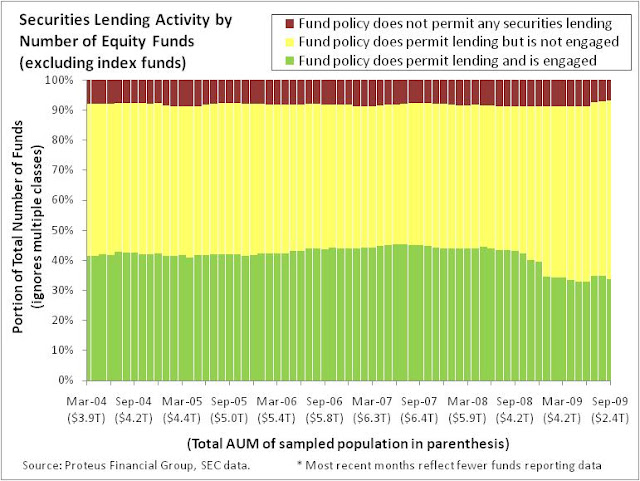
For actively-managed equity funds, the portion of the population actively lending shares has decline steadily since late-2007. However, during 2009 this trend appeared to be reaching a turning point. This stabilization has yet to prove a turnaround.


In terms of assets (AUM), the vast majority of equity index funds lend shares, but in terms of number of funds, they appear to utilize securities lending similarly to their actively-managed counterparts. Of course, this implies that the largest equity index funds are dominating the supply of lendable shares. Overall, the decline in securities lending also appears to be muted. One reason should be that equity index funds should be inclined to loan securities given the additional revenue has a relatively material impact on reducing their expense ratios.


Furthermore, actively-managed equity funds are more likely than their indexed counterparts to not allow securities lending (represented by the red bars). By number of funds, the portion which utilize securities lending (green bars) are consistent between the active and passive groups.


The next update will include funds reporting through December 2009, which constitutes a large portion of the entire sample. Then we should be able to better determine the near-term course of these trends.